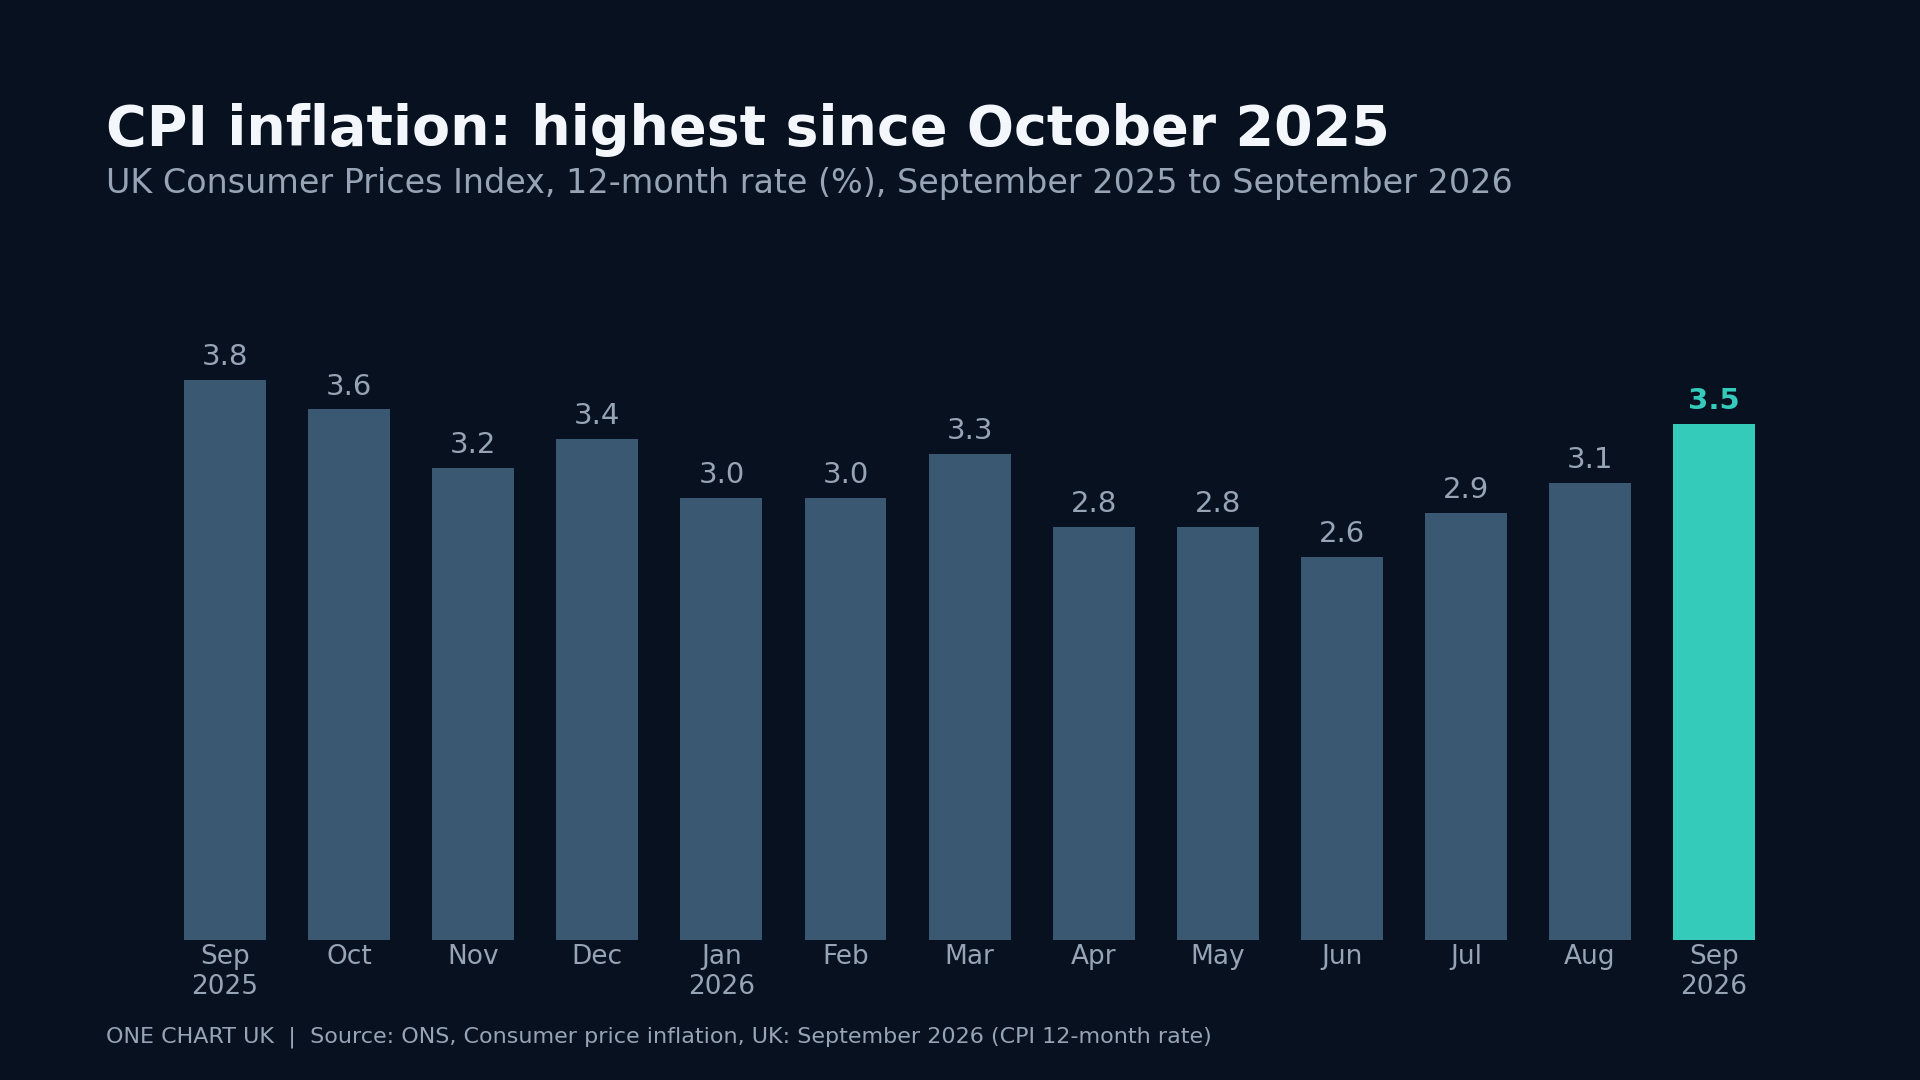
CPI inflation rises to 3.5%, highest since October 2025
21 October 2026 · Source
Official data. Plain English. One chart at a time.
21 October 2026 · Source
One Chart UK publishes one original chart at a time, built directly from official statistics - the ONS, the Bank of England, NHS England and friends. Every figure is read in the primary source before it is drawn, and every post links the source so you can check the working. No opinion, no spin: just what the numbers say.